
VANTAGE CORE EXPLORATION SOFTWARE
Your exploration program,
live and legible.
The data your team already collects — collars, surveys, logs and assays — as an interactive map, a three-dimensional model and reports you can hand to a board.
SCROLL TO WALK THE MODEL ↓
WHAT IT DOES
Everything your program measures, drawn where it happened.
Core logs, assays, planned holes and surface samples all come off the records your team already keeps — and land in the same map, the same 3D model and the same hole record. Much of the work in between is done by AI: reading what arrives, mapping it to your program, and fact-checking it before it reaches the model.
AI does the part nobody wants to do
The week of transcribing and cross-checking, gone.
Your crew logs the way it always has. Everything that comes back from everyone else — a spreadsheet in whatever layout the contractor uses, drilling returns in an email, downhole surveys buried in a report — gets read, mapped to your program and checked before it reaches the model. Once the assays land, you also get an early read on what you are sitting on. Not a week of someone else's transcription first.
- Reads
- Any spreadsheet layout your team or your contractor already uses, plus drilling returns and downhole surveys as they arrive. Nothing gets reformatted and nobody re-keys.
- Checks
- New data is cross-checked against the rest of the program, so what doesn't line up surfaces before it reaches the model instead of after it reaches a report.
- Estimates
- Tonnage, grade and contained metal at the cut-offs you choose, with every input still visible — an idea of what is there, early enough to steer the next hole. Indicative only. It is not a certified resource or a statement for the market — classification stays with your QP.
The core log and its assays, in 2D and 3D
The log, the grades and the lab certificate — one record.
Lithology, structure and sample intervals come straight off the log your geologists already write, and render two ways at once: a downhole strip you read like a log sheet, and the same trace at true azimuth, dip and depth inside a model of the actual ground. The assays live on that same record — graded along the hole, and behind any interval the certificate itself: every element returned, who sampled it, the tag book and work order, the lab, the stage and the result date. Nothing to cross-reference against a separate file.
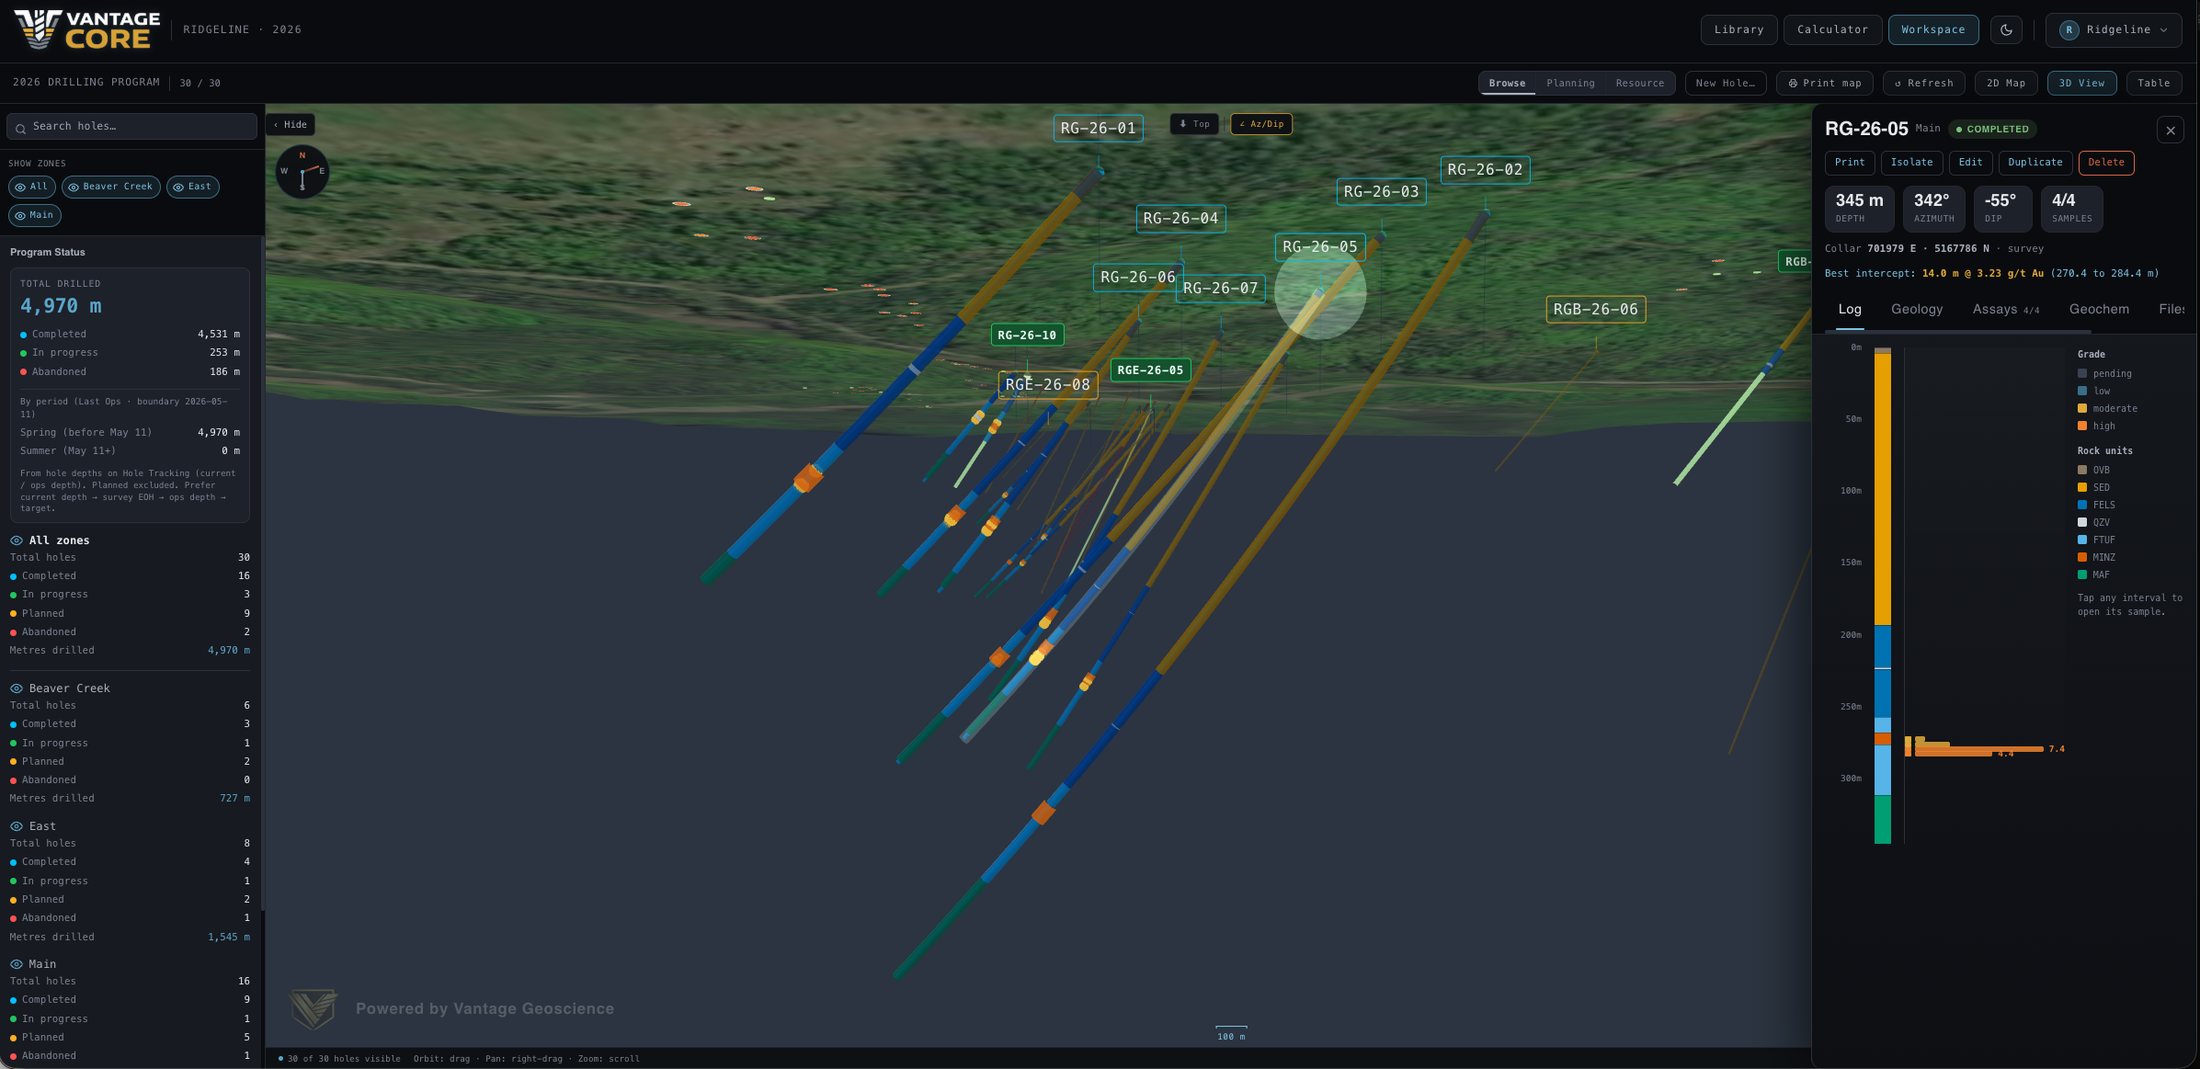
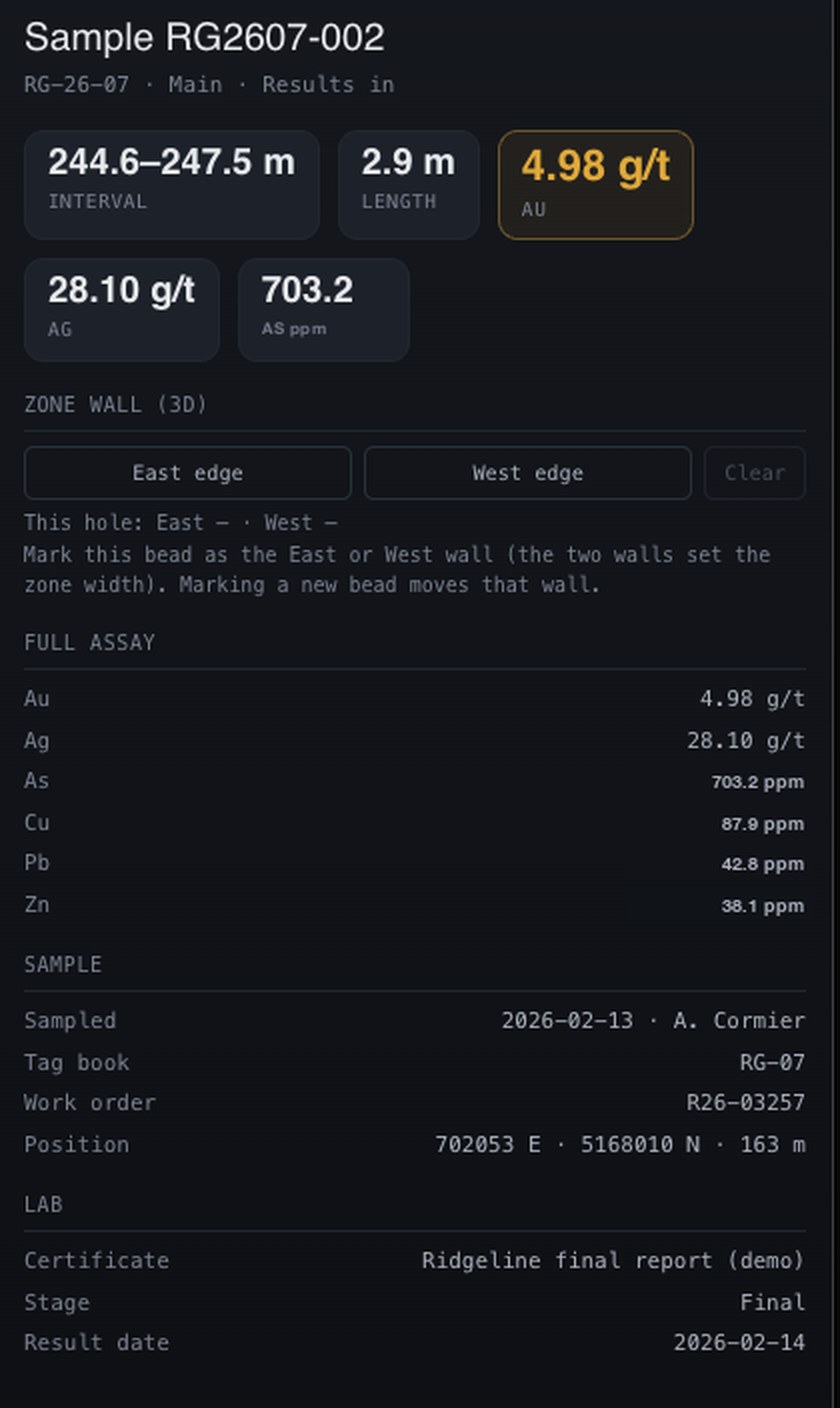
Open any interval and the paperwork is already there.
The number a geologist quotes and the document that backs it are one click apart, not one filing system apart.
- Interval
- From, to and length down the hole
- Grades
- The headline result, then the full element suite returned
- Custody
- Who sampled it and when, the tag book, the work order, the surveyed position
- Lab
- The certificate the numbers came from, whether the result is preliminary or final, and the date it landed
Drill planning
From target to hole in one pass.
Drop a collar, pick a target, and the azimuth, dip and length are solved for you — the draft hole drawn against everything already in the ground before you commit. Name it and it enters the program immediately as a planned hole, carrying its proposed geometry and target depth beside every hole already drilled, so the plan and the record never live in separate files.
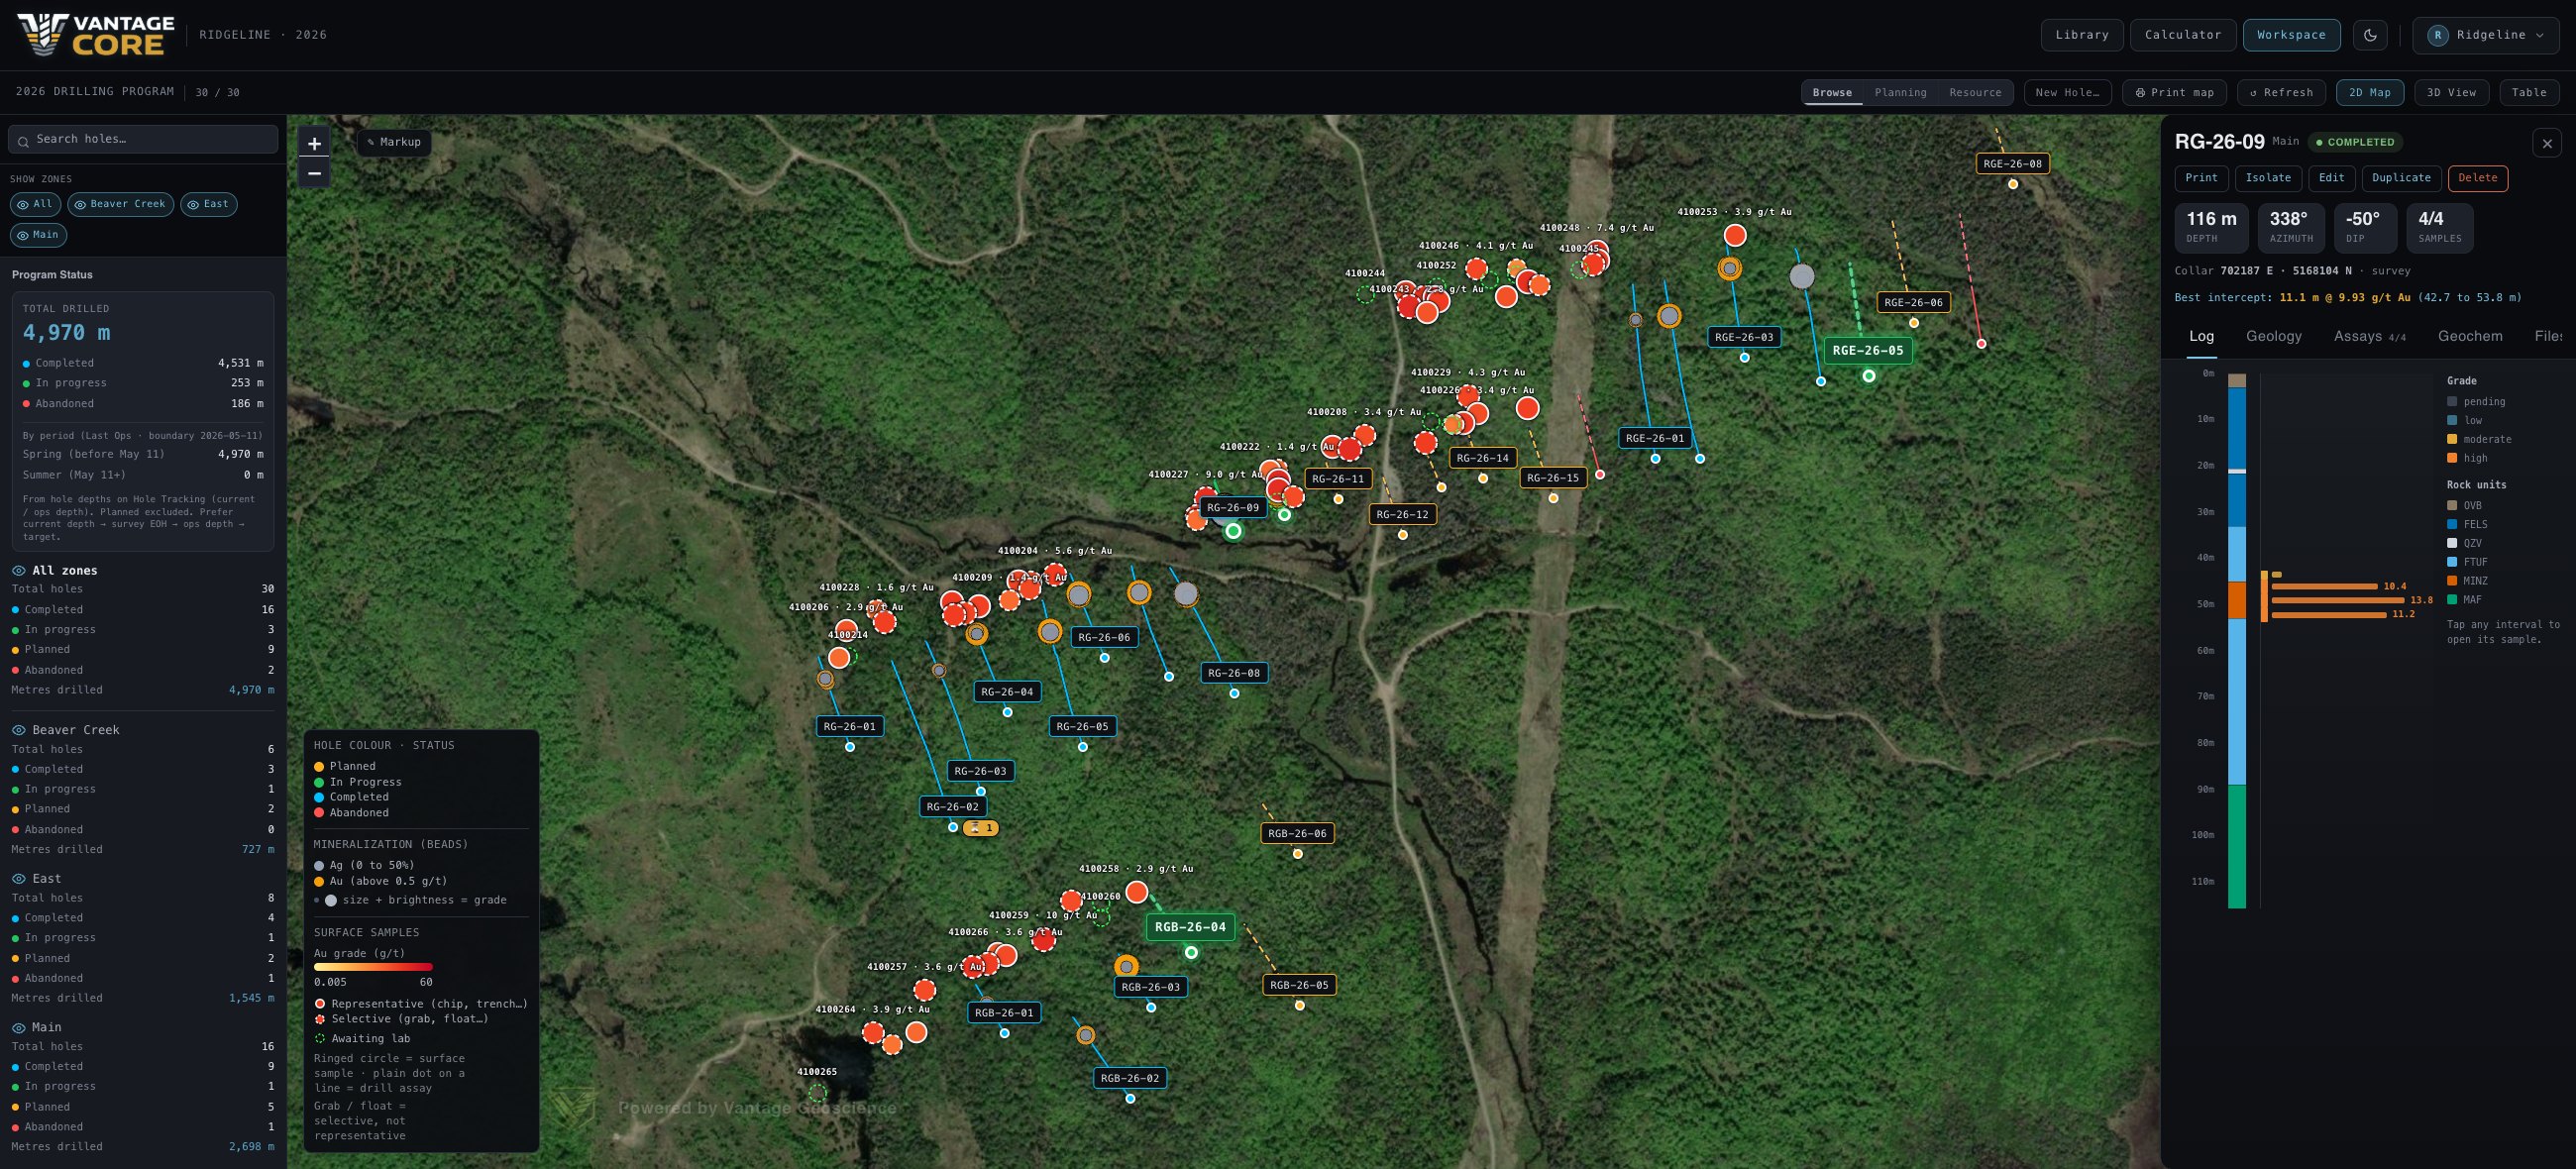
Surface sampling
Prove the target before you spend on drill metres.
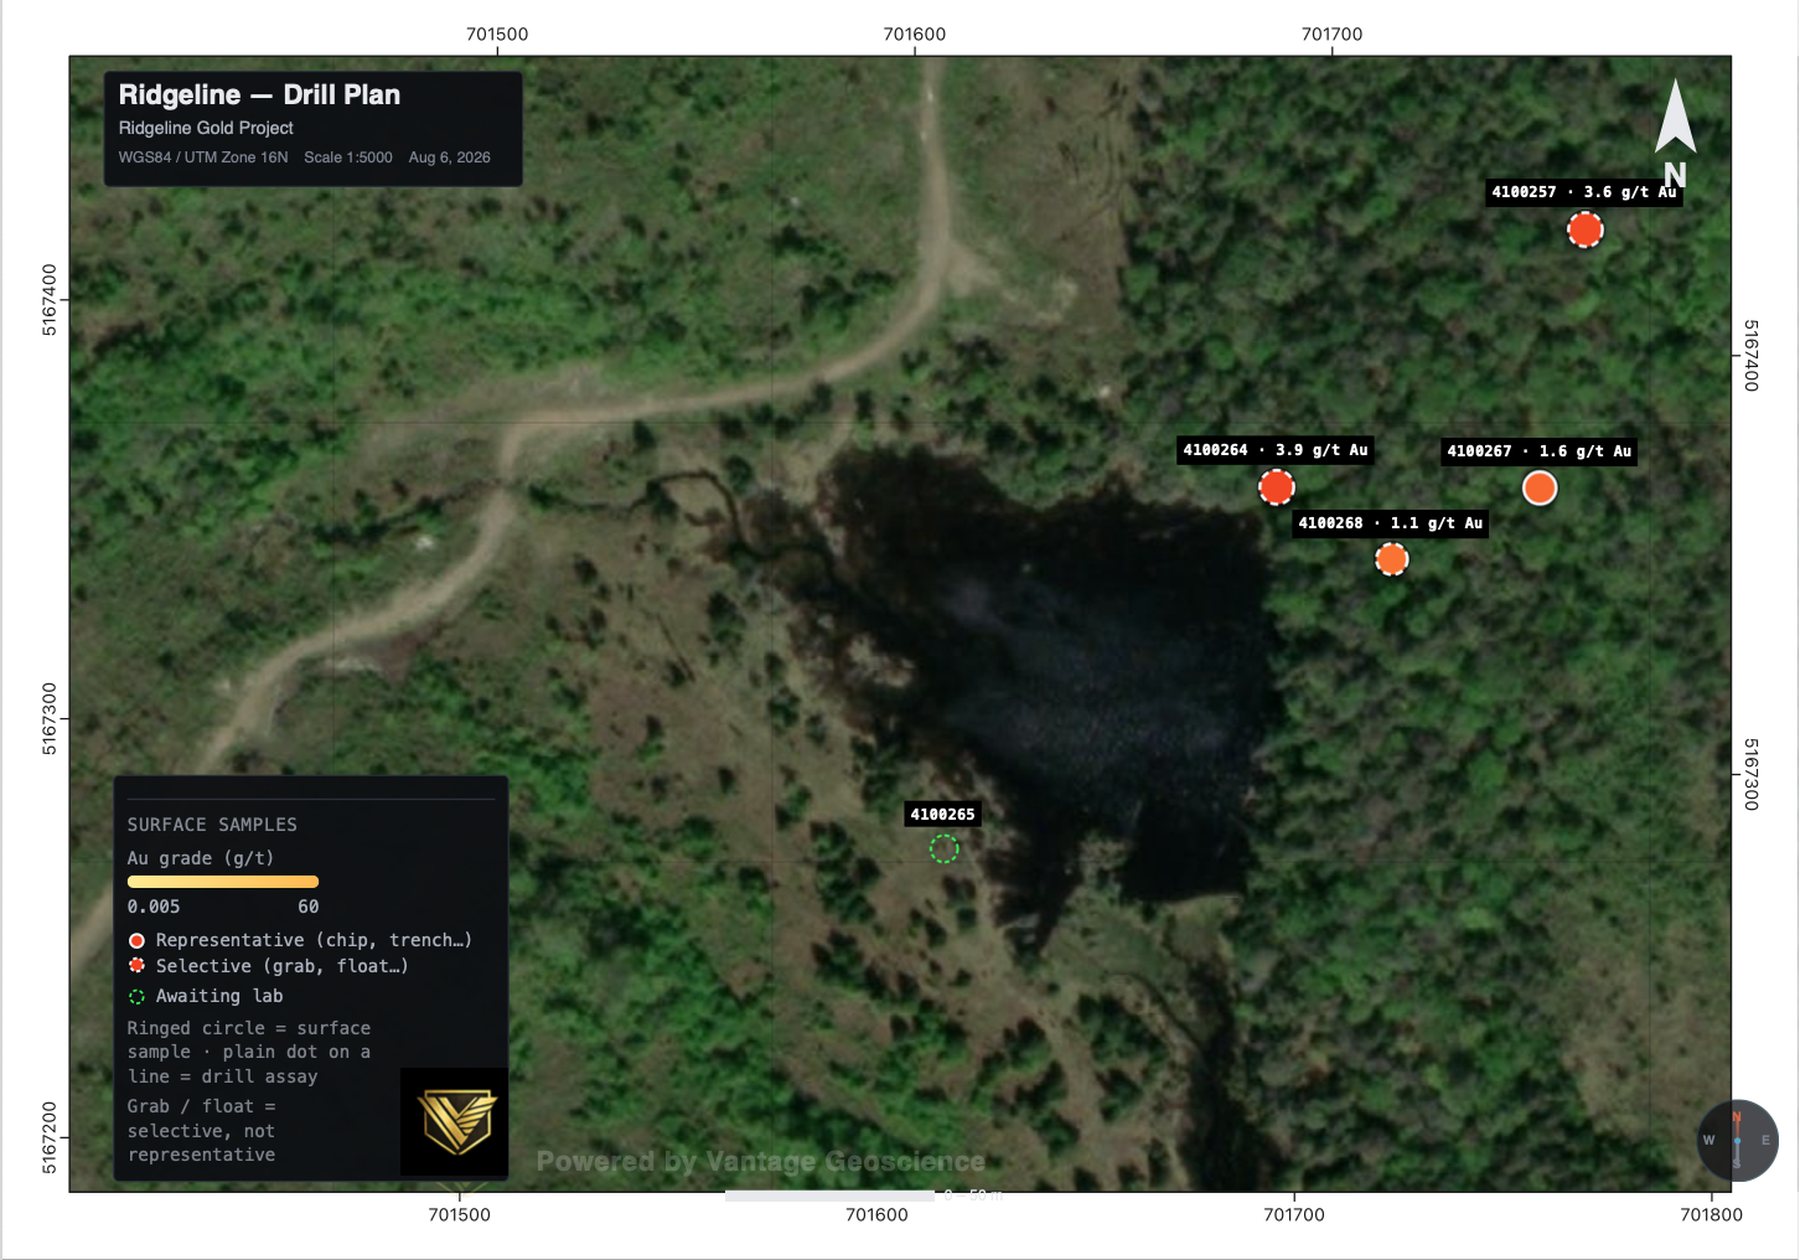
Grabs, channels and trench results map alongside the drill data on the grade scale the holes already use — so a surface anomaly and the intercept beneath it read as one picture, not two datasets. Each sample carries its number, its coordinates and its assays, and the map keeps representative results distinct from selective ones, so nobody reads a grab as if it were a channel. It exports that way too.
The rest of it, briefly.
- Live data sync
- Keeps reading the Excel or Google Sheet your team already keeps, so the program tracks it as it changes. Run it one-way to leave your sheet untouchable, or two-way to write results back.
- Proposed · actual · surveyed
- Every hole carries its planned collar, its as-drilled position and its downhole survey. The most reliable version available shows by default.
- Program map
- Every collar colour-coded by status and filterable by zone, year and stage, over satellite, topo or your own drone orthophoto, with claim boundaries as GeoJSON, KML or GPX.
- Print map designer
- Lay out a full-page sheet — layers, title block, scale bar, legend — and export a true PDF, not a screenshot.
- Share & embed
- Live links or iframe embeds for a whole project or a single hole. No login to view, revocable the moment you want them gone.
- Controlled access
- Google OAuth against an approved-user list you manage, with a session log of who signed in, from where and for how long.
- Data in
- Excel · Google Sheets · contractor emails and reports · downhole surveys · direct integrations where supported
- Overlays
- GeoJSON · KML · GPX · drone orthophotos
- Basemaps
- Satellite · topographic · standard
- Data out
- Print-ready PDF map sheets · single-hole PDF reports · CSV export
- Runs on
- Any modern browser. Nothing to install, no per-seat licence
- Setup
- Configured with your team during onboarding, to your program's requirements
CONTACT
Tell us about your program.
Every deployment is configured with your team during onboarding, so the first conversation is about how your crew already logs, samples and reports — not about our feature list.